
Frontend observability that works
99.9% uptime doesn't mean 99.9% of users had a good experience. One slow checkout flow for iOS users in Germany costs thousands in lost revenue. See exactly what's breaking, for whom, and why.
New to the topic? Start with our frontend observability guide, then come back when you're ready to implement.
Monitoring tells you WHEN. Observability tells you WHY.
Traditional monitoring is like a check engine light. It tells you something is wrong ("High Error Rate"), but it doesn't tell you why it's happening or who is affected.
You need more than just red lights. You need to know that the regression is only happening to users on iOS 18 who have 3 items in their cart. That's the difference between guessing and fixing. Learn more about frontend observability.
The struggle: "Checkout is broken."
Okay, but why? Is it the DB? The payment gateway? A code bug? You spend 4 hours guessing.
The fix: "Stripe is timing out for iOS 18 users."
You know exactly where to look. You escalate to the partner API or deploy a fallback in minutes.
Problems observability reveals
Issues invisible to traditional monitoring that cost real revenue.
These issues affect small user segments but have outsized revenue impact. Traditional monitoring shows healthy averages whilst these problems silently cost thousands per month.
Production-ready observability in days, not months
We handle the complexity. You get a battle-tested pipeline that respects privacy, scales with traffic, and delivers insights from day one. New to observability?
See what users actually experience
Know which checkout flows are slow, which buttons feel unresponsive, and which errors block conversions - with full device, browser, and network context.
- Core Web Vitals traced to specific resources
- Failed API calls with full request details
- JavaScript errors with user journey context
Follow requests end-to-end
Trace a single user action from browser click through your entire backend stack. See exactly where time is spent and where failures occur.
- Frontend → API → database → response in one view
- Find slow queries blocking user interactions
- Identify which third-party scripts cause delays
Ask any question about your data
No pre-aggregated dashboards. Query by any combination: device + geography + cart value + feature flag + user segment. Find the needle in the haystack.
- "Show slow checkouts for iOS users in France"
- "Which browsers have high error rates?"
- "Does LCP correlate with conversion rate?"
Production-ready from day one
We configure privacy controls, sampling strategies, and retention policies based on your requirements. GDPR-compliant and ready for EU customers.
- PII automatically scrubbed from traces
- Adaptive sampling to control costs
- EU data residency available
⚡ Performance Impact
Our instrumentation is designed for production environments:
- Minimal overhead - runs asynchronously
- Non-blocking - never delays user interactions
- Adaptive sampling - scales with traffic
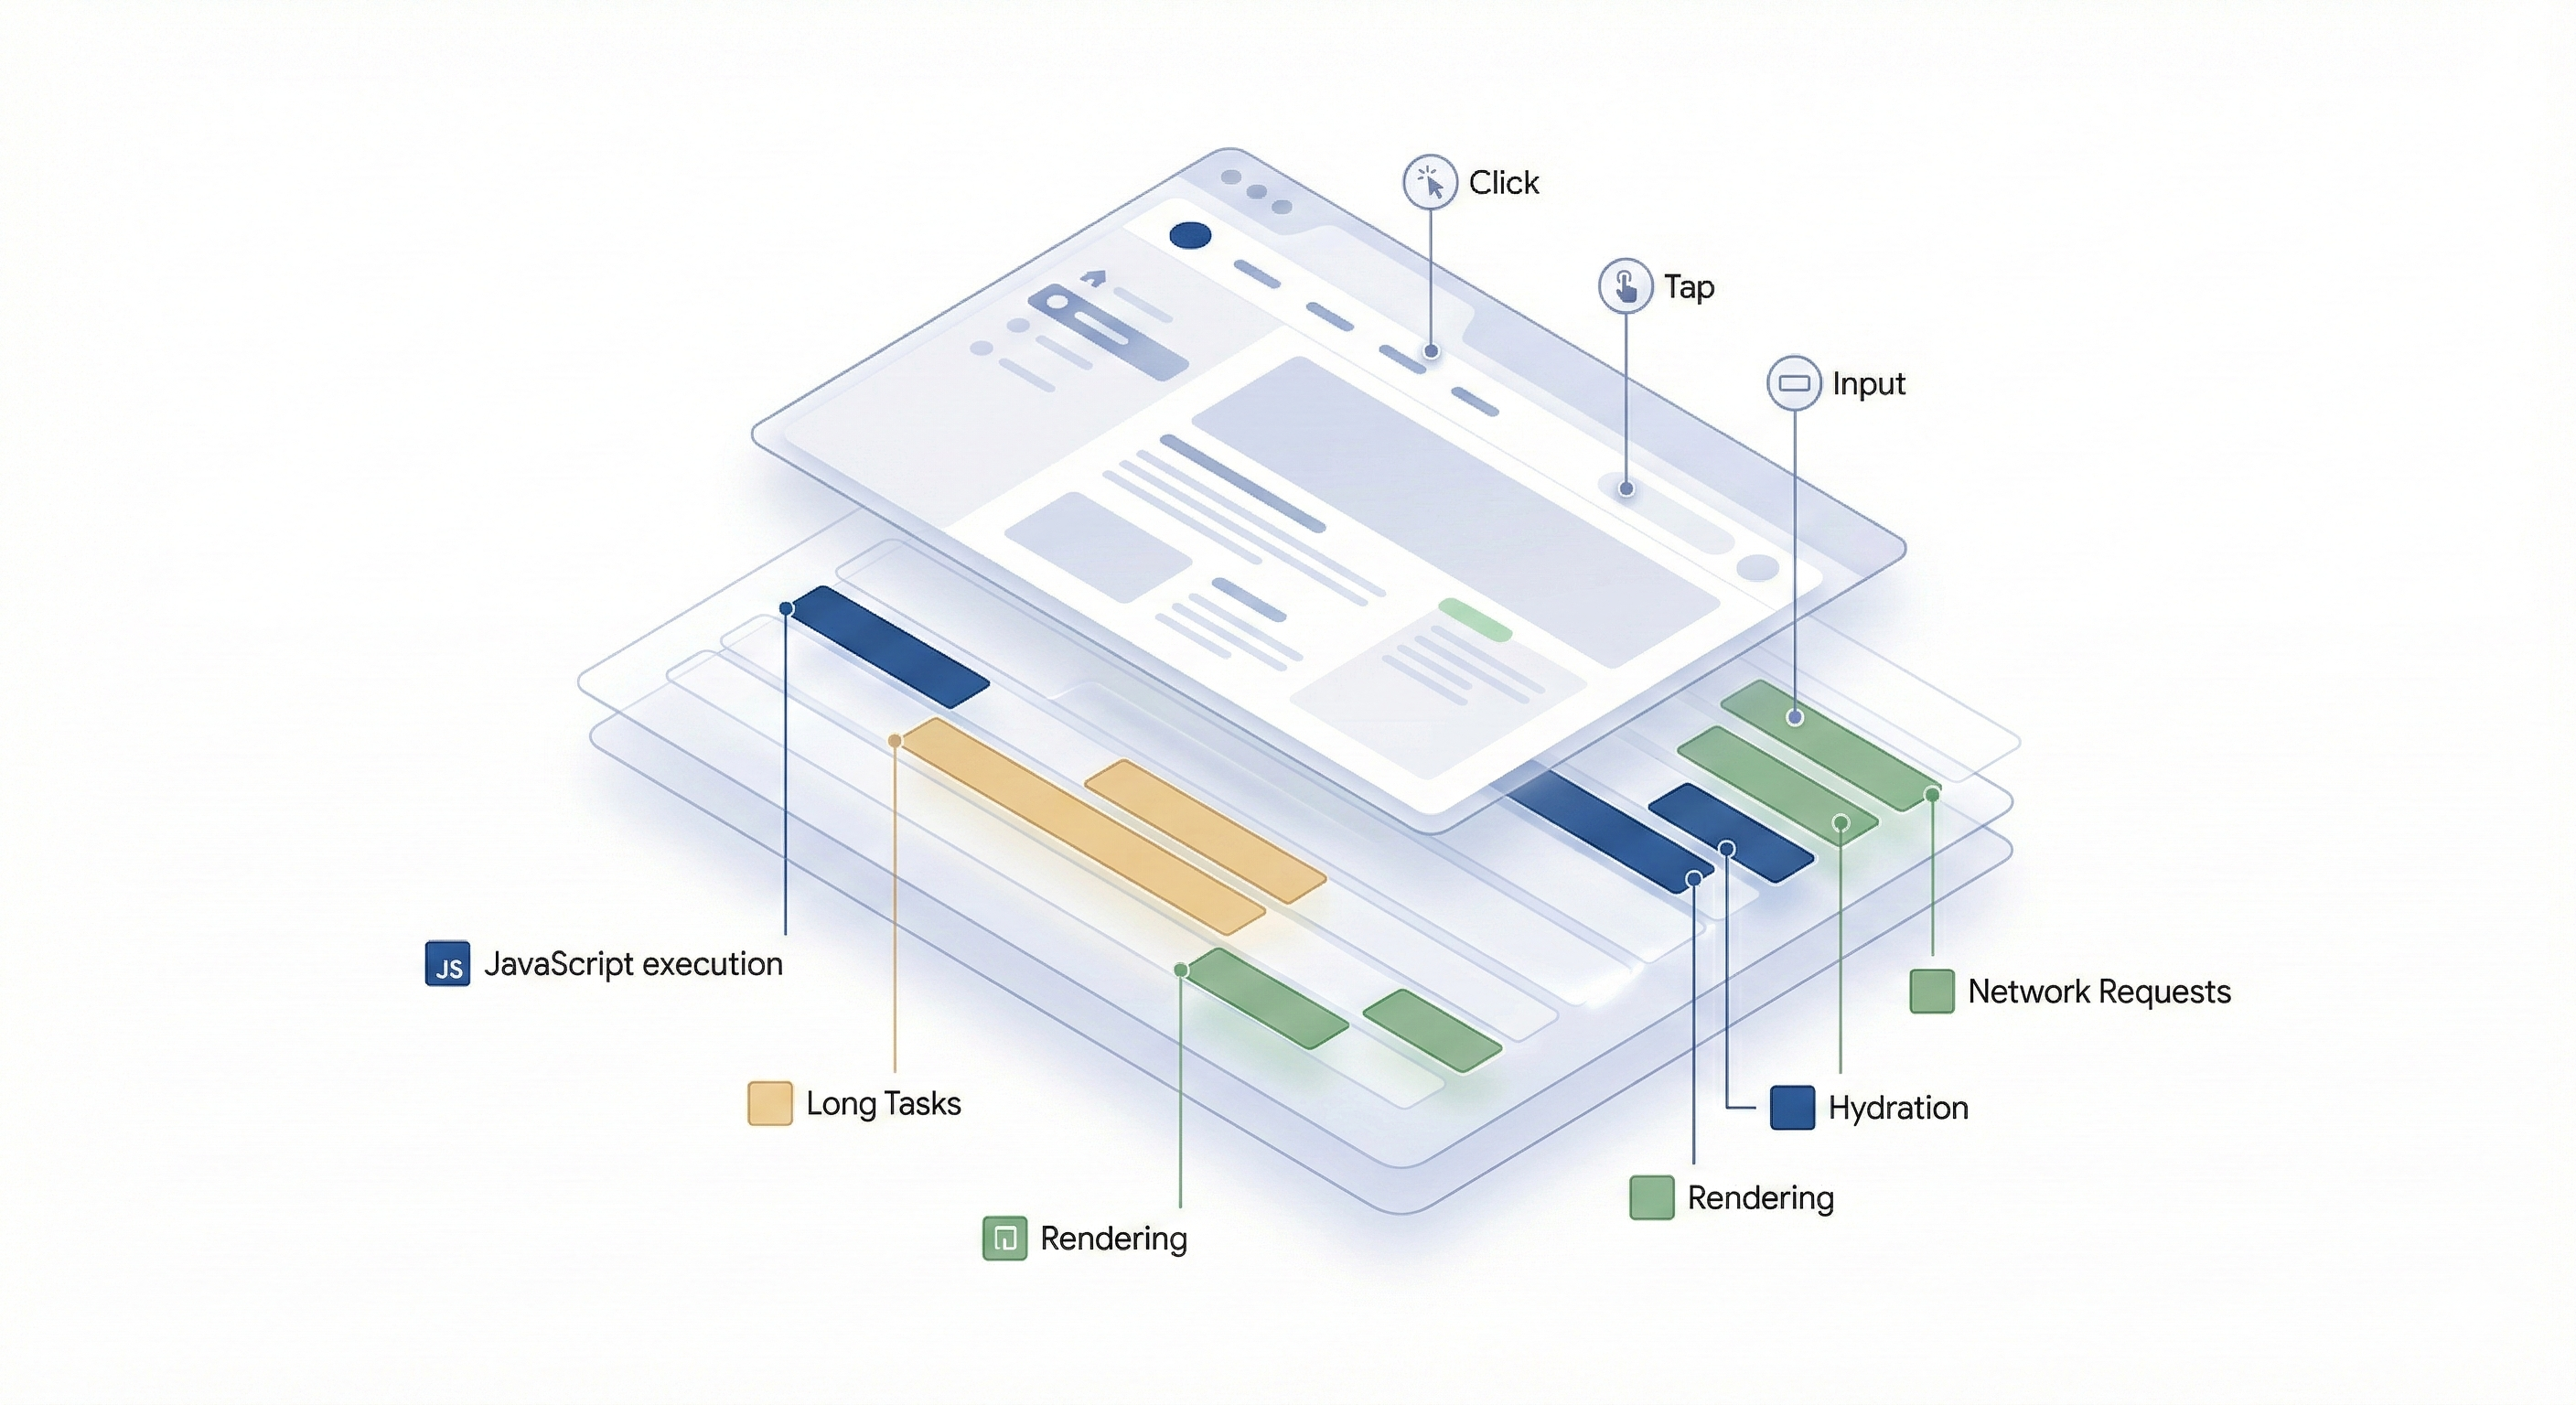
Why OpenTelemetry-based observability?
Not all observability solutions are built for modern frontend challenges. Here's how different approaches compare.
Sentry: Good for errors
Sentry: errors only
Simple integration, powerful insights
Works with React, Next.js, Vue, or any modern JavaScript framework. Here's what implementation looks like.
// app/layout.tsx or _app.tsx
import { WebTracerProvider } from '@opentelemetry/sdk-trace-web';
import { getWebAutoInstrumentations } from '@opentelemetry/auto-instrumentations-web';
import { registerInstrumentations } from '@opentelemetry/instrumentation';

const provider = new WebTracerProvider();
provider.register();

registerInstrumentations({
  instrumentations: [
    getWebAutoInstrumentations({
      '@opentelemetry/instrumentation-fetch': {},
      '@opentelemetry/instrumentation-xml-http-request': {},
    }),
  ],
});

export default function App({ Component, pageProps }) {
  return <Component {...pageProps} />
}// Track checkout flow performance
import { trace } from '@opentelemetry/api';
function CheckoutButton() {
const handleCheckout = async () => {
const tracer = trace.getTracer('checkout');
const span = tracer.startSpan('checkout.initiated');
span.setAttribute('cart.items', cartItems.length);
span.setAttribute('cart.value', totalValue);
span.setAttribute('user.segment', userSegment);
try {
await processPayment();
span.setStatus({ code: SpanStatusCode.OK });
} catch (error) {
span.recordException(error);
span.setStatus({ code: SpanStatusCode.ERROR });
} finally {
span.end();
}
};
return <button onClick={handleCheckout}>Pay Now</button>;
}That's it. You now see every checkout attempt with full context: which items, what value, which user segment, and whether it succeeded or failed. Query by any combination in your observability platform.
Trusted by performance-focused teams
 https://www.dpgmedia.nl
 https://www.volkskrant.nl
 https://www.sportsdirect.com
 https://www.flannels.com
 https://www.houseoffraser.co.uk
 https://www.fivedegrees.com
 https://www.parool.nl
 https://www.libelle.nl
 https://www.autoweek.nl
 https://www.prorail.nl
 https://www.simyo.nl
 https://www.fugro.com
 https://www.giftcards.co.uk
 https://www.bikkelhart.nl
 https://www.dynamicpeople.nl
 https://mannenzaken.nl
 https://www.primadonna.com
 https://www.mariejo.com
 https://www.rigbyandpeller.com
 https://www.smartbuyglasses.com
 https://www.livefootballtickets.com
What the work delivers
Mobile INP fell from 413ms to 150ms, lifting the UX Score from 82 to 100.
The share of mobile URLs passing Core Web Vitals rose from 25.8% to 93%.
INP work across flannels.com, sportsdirect.com and houseoffraser.co.uk, with the UX Score computed weekly from their own RUM data.
Common Questions
Stop flying blind.
Start seeing the truth.
Let's talk about your frontend blind spots. We'll show you exactly which user experiences are costing you revenue and how to fix them.