Time to First Byte (TTFB): Fix the bottleneck slowing everything else
Your server takes 2.3 seconds to respond. During that time, users see a blank screen. Nothing loads. No images, no text, nothing. They're gone before your page even starts rendering. TTFB is the hidden tax on every other metric.
What is TTFB (and why it matters)?
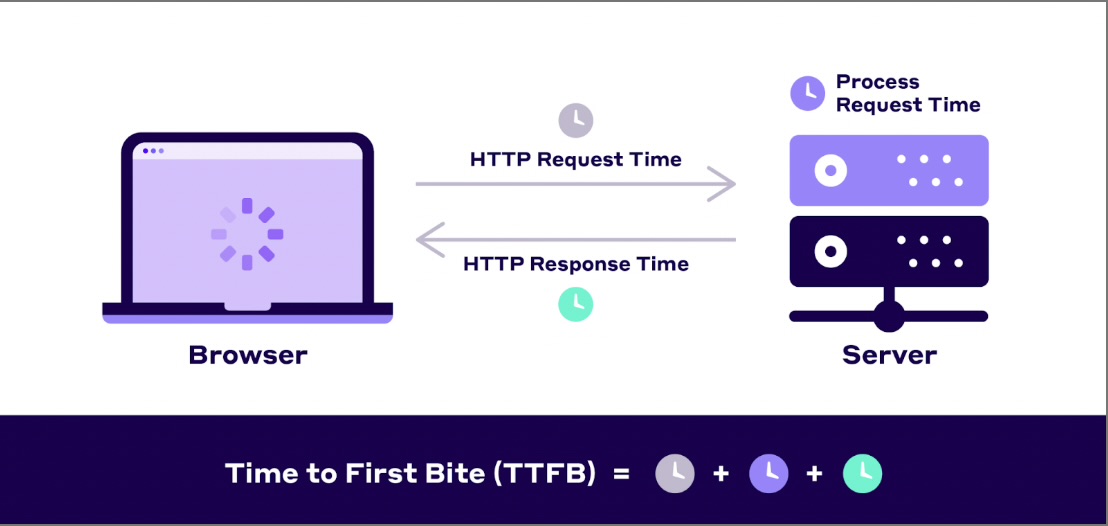
TTFB measures how long until the browser receives the first byte from your server. It's the time from when a user requests a page to when the server starts sending data. During this time, users see a blank screen.
Important: TTFB is not an official Core Web Vital, but it directly impacts LCP and FCP. Google considers it a foundational metric for overall page performance. If your TTFB is slow, everything else loads late.
Critical: TTFB has multiple definitions
Different measurement tools use different starting points for TTFB calculations. Understanding which variant you're measuring is essential for accurate performance analysis and fair comparisons.
TTFB thresholds (Navigation TTFB)
Throughout this guide, we use Navigation TTFB (the CrUX definition) unless otherwise stated.
What's included in Navigation TTFB?
Navigation TTFB components (startTime → responseStart):

1. Redirects          (0ms if no redirects)
2. Service worker     (0ms if not used)
3. Browser cache      (checking local cache)
4. DNS lookup         (0-100ms, or 0ms if cached)
5. TCP connection     (1 RTT, or 0ms if reused)
6. TLS handshake      (1-2 RTT, or 0ms if reused)
7. HTTP request       (minimal)
8. Server processing  (varies widely)
9. Response start     (first byte arrives)

Note: Many subparts can be 0ms depending on caching,
connection reuse, and other factors.
Understanding TTFB variability
TTFB combines multiple components that behave differently based on caching and connection state. Requests on established connections skip DNS and TLS setup (0ms), while new connections include full overhead. Cached resources bypass network entirely. This creates distinct performance clusters in your data - some loads are fast, others slow - which means median or percentile values may hide important patterns in user experience.
Why TTFB matters for performance
TTFB is the starting gun for page loading. Every millisecond of TTFB delay adds to LCP, FCP, and overall load time. Fast TTFB creates a performance multiplier effect.
LCP impact
If TTFB is 2 seconds, your LCP can't be better than 2 seconds. Fast TTFB gives you room to optimise other aspects of loading.
FCP impact
Nothing renders until the HTML arrives. Slow TTFB means users stare at blank screens longer, even if your CSS and JavaScript are perfectly optimised.
Perceived performance
Users on slow connections are especially sensitive to TTFB. A 500ms reduction in TTFB feels dramatically faster than micro-optimising JavaScript.
Research shows that reducing TTFB from 1.5s to 500ms can improve conversion rates by 7-10%. Server speed is invisible to users, but they definitely feel it.
How to measure TTFB
Field data (Real users)
Real user TTFB varies by location, network quality, and server load. Field data shows what your users actually experience:
- Iron/Out free benchmark - Get your TTFB from Chrome UX Report
- PageSpeed Insights - Shows field TTFB data from Chrome UX Report when available
- Real User Monitoring - Track TTFB for every visitor with our observability implementation
Lab data (Testing)
Test TTFB from different locations and configurations:
- WebPageTest - Test from multiple global locations, shows TTFB breakdown
- Lighthouse - Reports TTFB in the diagnostics section
- Chrome DevTools - Network tab shows timing for each request
Measure TTFB in Chrome DevTools
// Chrome DevTools Network tab:
// 1. Open DevTools (F12)
// 2. Go to Network tab
// 3. Reload the page
// 4. Click on the main document request
// 5. Go to Timing tab
// 6. "Waiting for server response" = TTFB

// TTFB includes:
// - Queueing
// - Stalled
// - DNS Lookup
// - Initial connection
// - SSL
// - Request sent
// - Waiting (TTFB)
Measure TTFB programmatically
Install the web-vitals library:
npm install web-vitalsThen track TTFB:
import {onTTFB} from 'web-vitals';

onTTFB((metric) => {
  console.log('TTFB:', metric.value);

  // Send to analytics
  analytics.track('ttfb', {
    value: metric.value,
    rating: metric.rating, // 'good', 'needs-improvement', 'poor'
    navigationType: metric.navigationType
  });
});

// Or use Navigation Timing API directly
const observer = new PerformanceObserver((list) => {
  const entries = list.getEntries();
  entries.forEach((entry) => {
    if (entry.entryType === 'navigation') {
      const ttfb = entry.responseStart - entry.requestStart;
      console.log('TTFB:', ttfb);
    }
  });
});

observer.observe({ type: 'navigation', buffered: true });
Common causes of slow TTFB
1. Slow server processing
Server-side rendering, database queries, and API calls all add to TTFB. Complex page logic can take hundreds of milliseconds before sending the first byte.
Fix: Cache rendered pages, optimise database queries, use edge rendering.
2. No CDN or poor CDN configuration
Users far from your origin server face high latency. A user in Australia requesting from a US server adds 200-300ms just for the round trip.
Fix: Use a global CDN to serve content from edge locations near users.
3. Insufficient server resources
Underpowered servers struggle under load. CPU bottlenecks, memory constraints, and slow disk I/O all increase TTFB during traffic spikes.
Fix: Scale server resources, implement caching, optimise backend code.
4. Database query performance
Slow queries, missing indexes, and N+1 query problems can add seconds to TTFB. Each uncached database hit adds latency.
Fix: Add database indexes, implement query caching, use read replicas.
5. Network latency
DNS lookup time, TCP handshake, and TLS negotiation all contribute to TTFB. Poor network routing can add significant overhead.
Fix: Use DNS prefetching, enable HTTP/3, implement connection prewarming.
TTFB optimisation techniques
1. Use a CDN for edge caching
Set proper cache headers
// Express.js: Set cache-control headers
app.get('/api/data', (req, res) => {
  res.set('Cache-Control', 'public, max-age=3600, s-maxage=86400');
  res.json(data);
});

// Nginx: Cache static assets
location ~* \.(jpg|jpeg|png|gif|ico|css|js|woff2)$ {
  expires 1y;
  add_header Cache-Control "public, immutable";
}
Impact: CDN caching can reduce TTFB from 500-1000ms to 20-50ms for cached responses.
2. Optimise server-side processing
Database query optimisation
// Bad: N+1 query problem
const users = await db.query('SELECT * FROM users');
for (const user of users) {
  user.posts = await db.query(
    'SELECT * FROM posts WHERE user_id = ?',
    [user.id]
  );
}
// TTFB: 500-2000ms (100 queries)

// Good: Single query with JOIN
const users = await db.query(`
  SELECT
    users.*,
    posts.id as post_id,
    posts.title as post_title
  FROM users
  LEFT JOIN posts ON posts.user_id = users.id
`);
// TTFB: 50-150ms (1 query)

// Better: Add indexes
CREATE INDEX idx_posts_user_id ON posts(user_id);
CREATE INDEX idx_users_email ON users(email);
// Query time: 100ms -> 5ms
Implement incremental static regeneration
// Next.js: ISR for fast TTFB with fresh content
export async function getStaticProps() {
  const data = await fetchData();

  return {
    props: { data },
    // Serve cached page, rebuild in background
    revalidate: 60 // Check for updates every 60 seconds
  };
}

// First request after revalidate:
// - User gets cached version (TTFB: 50ms)
// - New version builds in background
// - Next user gets updated version

// Without ISR:
// - Every request hits database (TTFB: 500ms+)
3. Enable HTTP/3 and modern protocols
// Cloudflare: HTTP/3 enabled by default
// Reduces TTFB by 20-30% on mobile networks

// Nginx: Enable HTTP/3
server {
  listen 443 quic reuseport;
  listen 443 ssl http2;

  ssl_protocols TLSv1.3;
  ssl_early_data on; # 0-RTT

  add_header Alt-Svc 'h3=":443"; ma=86400';
}

// Benefits:
// - Faster connection establishment
// - Better mobile performance
// - Head-of-line blocking eliminated
// - 0-RTT resumption (saves 1 RTT on repeat visits)
4. Reduce DNS lookup time
<!-- DNS prefetching for external domains -->
<link rel="dns-prefetch" href="//fonts.googleapis.com">
<link rel="dns-prefetch" href="//analytics.example.com">

<!-- Preconnect for critical origins -->
<link rel="preconnect" href="//api.example.com" crossorigin>

<!-- Use a fast DNS provider -->
Cloudflare DNS: ~10ms lookup time
Google DNS:     ~20ms
Default ISP:    ~50-200ms

<!-- Benefits: -->
DNS Prefetch:  Saves 20-100ms on first request
Preconnect:    Saves 20-100ms + TCP/TLS time
Advanced TTFB optimisation strategies
Edge rendering with Cloudflare Workers / Vercel Edge
// Render React at the edge, closest to users
import { renderToString } from 'react-dom/server';
import App from './App';

export default async function handler(request) {
  const html = renderToString(<App />);

  return new Response(html, {
    headers: {
      'Content-Type': 'text/html',
      'Cache-Control': 'public, s-maxage=60'
    }
  });
}

// Benefits:
// - 10-30ms TTFB globally
// - No origin server load
// - Scales infinitely
Advanced: 103 Early Hints
103 Early Hints allows servers to send resource preload instructions before the full HTML response is generated. While the server processes the request, the browser can start downloading critical CSS and fonts. This can reduce measured TTFB by 200-500ms.
Only use this if you have slow server-side processing and know which resources are critical. Cloudflare and Fastly support this natively. Empty 103 responses without meaningful resource hints just game the metric without improving real performance.
Optimise cold starts for serverless
// Vercel/Netlify: Reduce cold start times

// Bad: Large dependencies
import _ from 'lodash'; // 100KB
import moment from 'moment'; // 200KB
// Cold start: 500-1000ms

// Good: Import only what you need
import debounce from 'lodash/debounce'; // 5KB
import { format } from 'date-fns'; // 10KB
// Cold start: 100-200ms

// Keep functions warm
// - Use Vercel Edge Functions (no cold starts)
// - Or ping functions every 5 minutes
// - Or use reserved concurrency (AWS Lambda)
Database connection pooling
// Reuse database connections
import { Pool } from 'pg';

const pool = new Pool({
  max: 20, // Max connections
  idleTimeoutMillis: 30000,
  connectionTimeoutMillis: 2000
});

// Bad: New connection each request (100-200ms overhead)
app.get('/data', async (req, res) => {
  const client = new Client();
  await client.connect();
  const result = await client.query('SELECT * FROM data');
  await client.end();
  res.json(result.rows);
});

// Good: Reuse pooled connections (5-10ms overhead)
app.get('/data', async (req, res) => {
  const result = await pool.query('SELECT * FROM data');
  res.json(result.rows);
});
Monitoring TTFB over time
TTFB can degrade slowly as traffic grows or code complexity increases. Monitor it proactively.
Track TTFB by route and location
import {onTTFB} from 'web-vitals';

onTTFB((metric) => {
  analytics.track('ttfb', {
    value: metric.value,
    rating: metric.rating,
    page_path: location.pathname,
    navigation_type: metric.navigationType,
    connection_type: navigator.connection?.effectiveType,

    // Server timing breakdown (if available)
    server_timing: getServerTimingMetrics()
  });
});

function getServerTimingMetrics() {
  const navigation = performance.getEntriesByType('navigation')[0];
  const serverTiming = navigation.serverTiming || [];

  return serverTiming.map(entry => ({
    name: entry.name,
    duration: entry.duration
  }));
}
Server-Timing header for debugging
// Express middleware: Track backend timing
app.use((req, res, next) => {
  const start = Date.now();
  const timings = {};

  res.on('finish', () => {
    const total = Date.now() - start;
    res.set('Server-Timing', [
      `total;dur=${total}`,
      `db;dur=${timings.db || 0}`,
      `cache;dur=${timings.cache || 0}`,
      `render;dur=${timings.render || 0}`
    ].join(', '));
  });

  req.timing = timings;
  next();
});

// In route handler
app.get('/product/:id', async (req, res) => {
  const cacheStart = Date.now();
  const cached = await cache.get(req.params.id);
  req.timing.cache = Date.now() - cacheStart;

  if (cached) return res.json(cached);

  const dbStart = Date.now();
  const product = await db.getProduct(req.params.id);
  req.timing.db = Date.now() - dbStart;

  res.json(product);
});

// Visible in Chrome DevTools Network -> Timing tab
Set up alerts
- P75 TTFB threshold: Alert when 75th percentile exceeds 800ms
- Regional monitoring: Track TTFB by geographic region
- Regression detection: Alert when TTFB increases by >100ms after deployment
- Cache hit rate: Alert when CDN cache hit rate drops below a target threshold
Performance budgets
- TTFB P75: Under 800ms globally
- CDN cache hit rate: Above 90%
- Database query time: Under 50ms for most queries
- Origin server response: Under 200ms for cached content
TTFB optimisation checklist
Need help reducing your TTFB?
Server optimisation requires deep infrastructure knowledge. We can audit your backend, identify bottlenecks, and implement proven solutions. Get in touch or run a free benchmark to see your current TTFB.
Need help improving your TTFB?
We can audit your server infrastructure and implement optimisations that dramatically reduce response times.