Largest Contentful Paint (LCP): Stop losing sales to slow hero images
Your hero image is loading in 4.5 seconds. Users wait 2 seconds, assume your site is broken, and leave. You lose the sale before they even see what you're selling.
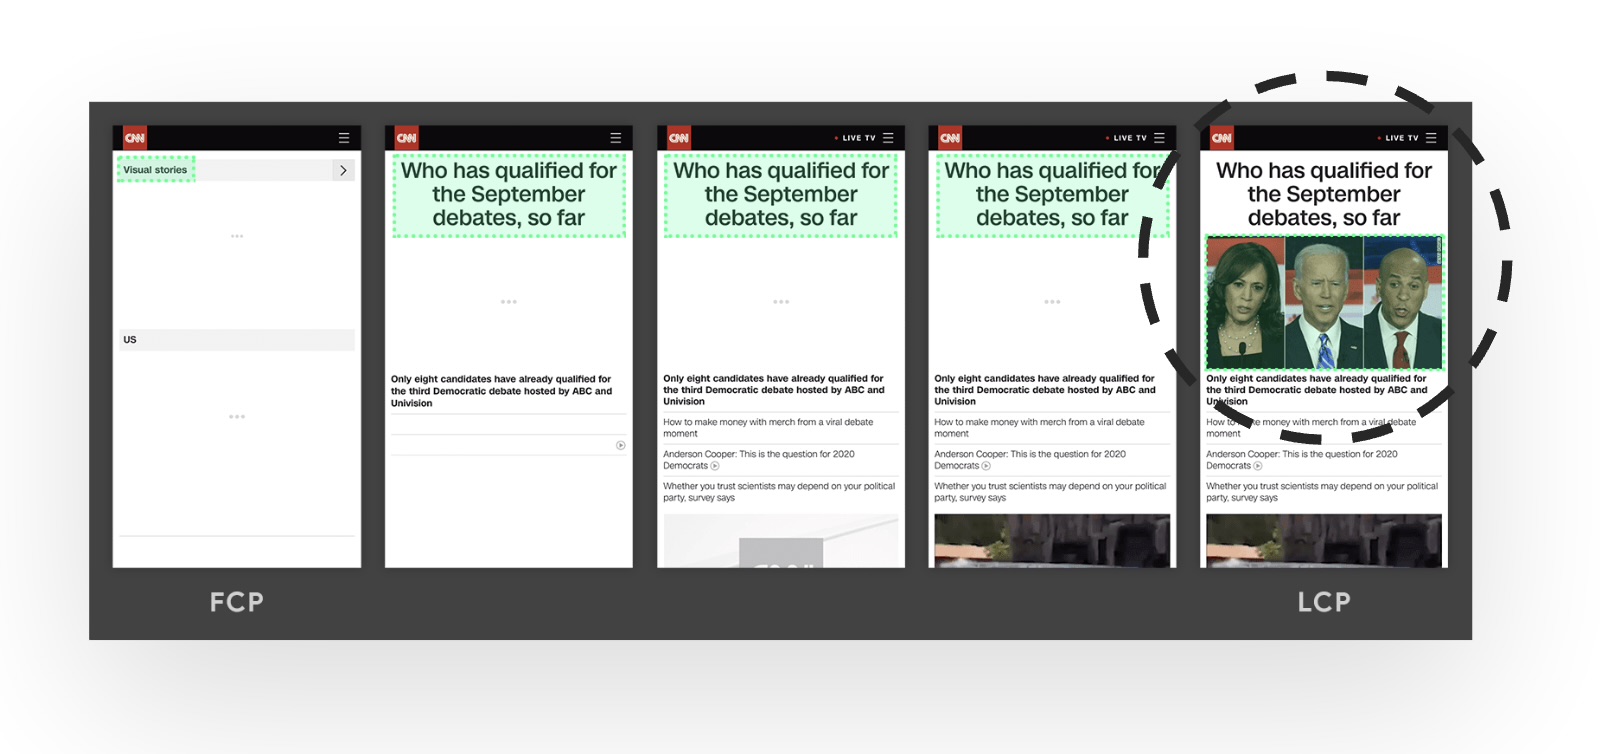
What is LCP (and why should you care)?
LCP measures when the main content of your page appears. Not when the whole page finishes loading. When the thing that matters most becomes visible.
For most sites, this is:
- The hero image on your homepage
- Product images on category or detail pages
- The header image on blog posts
- Large blocks of text if you don't use images
The problem: If your LCP element loads slowly, users think your entire site is broken. They don't see a loading spinner or realise JavaScript is still downloading. They just see a blank screen and leave.
Good LCP Threshold
The 2.5-second rule: Google sets "good" LCP at 2.5 seconds because that's when users start questioning whether your site works. Hit that threshold and you're in the green. Miss it and you're bleeding visitors.
The commercial cost of slow LCP
A slow hero image isn't just an engineering problem. It's a revenue problem. When your LCP exceeds 2.5 seconds:
53% bounce on mobile
Google's research: if your mobile page takes longer than 3 seconds, over half your visitors leave immediately.
7% conversion loss per second
Every second your LCP element is delayed, conversion drops by 7%. A 4-second LCP loses you 10.5% of potential revenue.
Lower search rankings
LCP is a ranking signal. Poor scores push you down in search results, costing you organic traffic.
Real example: An e-commerce site we audited had a 4.8-second LCP on product pages. Their analytics showed 61% of mobile users bounced within 5 seconds. We reduced LCP to 1.9 seconds. Bounce rate dropped to 34%. Same products, same prices, just faster images.
How to measure LCP (and which number to trust)
LCP can be measured two ways: in the lab (synthetic testing with tools) and in the field (real users on real devices). Both tell you different things.
Field data: What real users experience
This is what matters for rankings and revenue. Use these tools:
- Iron/Out Free Benchmark - Get your LCP from Chrome UX Report (28-day average of real users)
- Google Search Console - Core Web Vitals report shows which pages are failing and why
- Real User Monitoring (RUM) - Track LCP for every visitor with our observability setup
Trust field data for business decisions. Lab testing shows what could happen in perfect conditions. Field data shows what your actual customers experience on their actual devices and connections. That's what affects bounce rate and conversion.
Lab data: For development and debugging
Useful for testing changes before deployment:
- PageSpeed Insights - Quick test of any URL (look at field data first, lab data second)
- Chrome DevTools - Performance panel shows exactly which element is your LCP
- Lighthouse - Built into Chrome, gives you a score and suggestions
Measure LCP with JavaScript
Install Google's web-vitals library first:
npm install web-vitalsThen track LCP in your code:
// Track LCP with Web Vitals library
import {onLCP} from 'web-vitals';

onLCP((metric) => {
  console.log('LCP:', metric.value, 'ms');
  console.log('LCP element:', metric.entries[0].element);

  // Send to analytics
  gtag('event', 'web_vitals', {
    name: 'LCP',
    value: metric.value,
    metric_id: metric.id
  });
});
The web-vitals library is Google's official JavaScript library for measuring Core Web Vitals. It handles all the browser API complexity for you.
Understanding LCP sub-parts (for debugging)
Your LCP score is actually four separate timings added together. When you're debugging a slow LCP, knowing which part is the bottleneck tells you exactly where to fix.
LCP breakdown (4 parts):

1. TTFB               → Server response time
2. Resource load delay → How long until browser requests the image
3. Resource load time  → Image download duration
4. Render delay       → Time from download to paint
How to use this: Chrome DevTools shows you the LCP breakdown in the Performance tab under "Insights." Look at which sub-part is biggest. That's your bottleneck.
If TTFB is biggest (over 800ms)
Your server or CDN is slow. The browser can't even start loading the image until the HTML arrives. Fix your backend first.
If resource load delay is biggest (over 500ms)
The browser discovered your image too late. Probably because it's a CSS background image, or you lazy-loaded it, or render-blocking scripts delayed parsing. Use <link rel="preload"> or put the image directly in HTML.
If resource load time is biggest (over 1000ms)
Your image file is too big or the network is slow. Compress the image, use WebP/AVIF, serve smaller sizes to mobile. This is the most common problem (73% of LCP elements are images).
If render delay is biggest (over 200ms)
Something is blocking the browser from painting after the image downloads. Usually A/B testing scripts that hide the page, or heavy JavaScript blocking the main thread. Check what's running when the image finishes loading.
Pro tip: Most sites have resource load time as the biggest sub-part. Start by optimising your images. If that doesn't fix it, then dig into the other sub-parts.
Why your LCP is slow (the usual suspects)
We've audited hundreds of sites. These are the issues that show up repeatedly:
1. Massive, unoptimised images
Your designer exported a 3.2MB PNG hero image at 4000px wide. Mobile users on 4G are downloading a file 10x larger than necessary. This is the single most common cause of slow LCP we see.
Fix: Use modern formats (WebP or AVIF), compress aggressively, and serve appropriately-sized images for each viewport.
2. Slow server response (TTFB over 800ms)
If your server takes 2 seconds to respond, the browser can't even start downloading your image. The page sits blank while the server grinds through database queries or waits for third-party APIs.
Fix: Use a CDN to cache pages at the edge, optimise database queries, or move to Cloudflare with proper caching.
3. Render-blocking CSS and JavaScript
Your browser downloads 200KB of CSS before it can even start rendering the page. Meanwhile, analytics scripts and A/B testing tools block the main thread.
Fix: Keep critical CSS small (under 50KB), defer non-essential styles, and load third-party scripts asynchronously.
4. Client-side rendering with React/Vue
You're using a modern JavaScript framework, but your entire page content is rendered client-side. Users see a blank screen until React downloads (300KB), parses, executes, fetches data from an API, and finally renders the hero section.
Fix: Server-side rendering (SSR) or static site generation (SSG). Next.js and Gatsby do this automatically.
5. Lazy loading the hero image
Someone added loading="lazy" to every image on your site, including the hero. With lazy loading, the browser defers downloading the image until it's near the viewport but for above-the-fold content, this just delays what should load immediately. This can add 500-800ms of unnecessary delay.
Fix: Never lazy load above-the-fold images. Use loading='eager' or remove the attribute entirely.
How to fix slow LCP (prioritised by impact)
1. Fix your images first
Images cause 90% of LCP problems. Start here. Everything else is secondary.
Convert to modern formats (30-50% smaller files)
<!-- Use WebP or AVIF instead of JPEG/PNG -->
<picture>
  <source srcset="hero.avif" type="image/avif">
  <source srcset="hero.webp" type="image/webp">
  <img src="hero.jpg" alt="Hero" width="1200" height="600">
</picture>

<!-- Result: 800KB JPEG → 240KB WebP → 180KB AVIF -->
WebP is supported in 95% of browsers. AVIF is newer and even better, but fallback to WebP for older browsers.
Serve the right size for each device (60-80% reduction on mobile)
<!-- Don't send a 3000px image to a 400px phone screen -->
<img
  srcset="
    hero-400.jpg 400w,
    hero-800.jpg 800w,
    hero-1200.jpg 1200w
  "
  sizes="(max-width: 768px) 100vw, 1200px"
  src="hero-800.jpg"
  alt="Hero"
  width="1200"
  height="600"
/>

<!-- Mobile gets 400px image (80KB), desktop gets 1200px (320KB) -->
Most sites serve full-resolution desktop images to mobile users. This is wasteful and slow.
Preload LCP Image
<!-- Schedule hero image for high-priority early fetch -->
<link
  rel="preload"
  as="image"
  href="hero.jpg"
  imagesrcset="
    hero-400.jpg 400w,
    hero-800.jpg 800w,
    hero-1200.jpg 1200w
  "
  imagesizes="(max-width: 768px) 100vw, 1200px"
/>

<!-- Note: preload schedules the fetch with higher priority,
     but doesn't guarantee immediate download. The browser
     still prioritises based on available bandwidth. -->
Impact: 0.2-0.8s LCP improvement (helps browser discover image earlier)
2. Reduce server response time
- Use a CDN: Serve content from locations close to users
- Implement caching: Cache pages at the edge with Cloudflare
- Optimise database queries: Use indexes, connection pooling, and query optimisation
- Upgrade hosting: Move to faster servers if you're on shared hosting
Target: Time to First Byte (TTFB) under 800ms
3. Eliminate render-blocking resources
Defer Non-Critical JavaScript
<!-- Load analytics and chat widgets after page load -->
<script src="analytics.js" defer></script>
<script src="chat-widget.js" async></script>

<!-- For React/Next.js, use dynamic imports -->
const ChatWidget = dynamic(() => import('./ChatWidget'), {
  ssr: false,
  loading: () => null
});
4. Use server-side rendering
If you're using React, Vue, or similar frameworks:
- Next.js: Use
getStaticPropsorgetServerSideProps - Gatsby: Already does this automatically
- Nuxt: Use
asyncDataorfetch
SSR ensures users see content immediately, even before JavaScript loads.
Advanced LCP optimisation strategies
Priority Hints
<!-- Tell browser this image is high priority -->
<img
  src="hero.jpg"
  alt="Hero"
  fetchpriority="high"
  width="1200"
  height="600"
/>

<!-- Deprioritize below-the-fold images -->
<img
  src="footer-logo.jpg"
  alt="Logo"
  fetchpriority="low"
  loading="lazy"
/>
Early Hints (HTTP 103)
Tell browsers to start downloading resources while the server is still generating the page:
// Server sends 103 Early Hints before full response
HTTP/1.1 103 Early Hints
Link: </hero.jpg>; rel=preload; as=image
Link: </styles.css>; rel=preload; as=style

// Then sends actual page
HTTP/1.1 200 OK
Content-Type: text/html
...
Supported by Cloudflare and modern CDNs.
Service Workers for Repeat Visits
// Cache LCP image for instant repeat visits
self.addEventListener('install', (event) => {
  event.waitUntil(
    caches.open('v1').then((cache) => {
      return cache.addAll([
        '/',
        '/hero.jpg',
        '/styles.css'
      ]);
    })
  );
});
Browser caching for repeat visits
First-time visitors pay the full download cost. Returning visitors shouldn't have to. Proper Cache-Control headers can reduce LCP dramatically on repeat visits by eliminating image downloads entirely.
Aggressive caching for versioned assets
<!-- Modern bundlers add hashes to filenames -->
<link rel="stylesheet" href="/styles.a3f2e1.css">
<img src="/hero.4d8b2c.jpg" alt="Hero">

<!-- Server response headers for hashed assets: -->
Cache-Control: public, max-age=31536000, immutable

<!-- Why this works: -->
- Filename changes when content changes
- Browser can cache safely for 1 year
- Repeat visit LCP: ~50ms instead of 800ms
- Cache hit rate: 95%+ for returning visitors
Impact: LCP improves from 2.1s to 300ms for repeat visitors
Cache revalidation for non-versioned content
<!-- For images without version hashes: -->
Cache-Control: public, max-age=86400, must-revalidate

<!-- Browser behaviour: -->
Day 1: Downloads image (800ms)
Day 2: Checks with server "Is this fresh?" (50ms)
       Server responds: "304 Not Modified"
       Browser uses cached copy (0ms download)

<!-- Result: -->
First visit:  LCP 2.1s (full download)
Repeat visit: LCP 650ms (validation only)
Don't cache HTML pages aggressively
Never use long cache times for HTML pages. They should have short max-age (60-300 seconds) or use must-revalidate. Otherwise, users won't see updates when you deploy. Cache images and CSS aggressively, HTML conservatively.
Speculation Rules API for instant navigation
The Speculation Rules API allows browsers to prerender entire pages before the user clicks. When implemented properly, this can make navigation feel instant with LCP under 100ms.
Basic prefetching with Speculation Rules
<!-- Add to your HTML: -->
<script type="speculationrules">
{
  "prefetch": [
    {
      "urls": ["/products", "/about", "/pricing"],
      "requires": ["anonymous-client-ip-when-cross-origin"],
      "referrer_policy": "no-referrer-when-downgrade"
    }
  ]
}
</script>

<!-- Browser prefetches these pages in the background -->
<!-- When user clicks, page loads instantly from cache -->
<!-- LCP: ~50-100ms instead of 2000ms -->
Aggressive prerendering for high-confidence links
<!-- Prerender = full page render in hidden tab -->
<script type="speculationrules">
{
  "prerender": [
    {
      "where": {
        "and": [
          {"href_matches": "/product/*"},
          {"selector_matches": ".product-card a"}
        ]
      },
      "eagerness": "moderate"
    }
  ]
}
</script>

<!-- Browser prerenders likely destination pages -->
<!-- When user clicks, page appears instantly -->
<!-- LCP: Effectively 0ms (already rendered) -->

<!-- Eagerness levels: -->
immediate - Prerender as soon as rule is seen
eager     - Prerender when link is visible
moderate  - Prerender on hover (200ms hover delay)
conservative - Prerender on pointer down
Impact: Near-instant navigation with perceived LCP under 100ms
Speculation Rules browser support
Speculation Rules API is supported in Chrome 109+ and Edge 109+. For unsupported browsers, the rules are silently ignored with no negative impact. Consider it progressive enhancement: Chrome users get instant navigation, others get normal performance. Check current browser support.
Use Speculation Rules carefully
Prerendering consumes bandwidth and server resources. Only prerender high-confidence destinations like product pages users are hovering over. Avoid prerendering your entire site or pages requiring authentication. Monitor prefetch/prerender hit rates to ensure you're not wasting resources.
Back/Forward Cache (bfcache)
The back/forward cache stores complete page snapshots when users navigate. When they hit the back button, the page appears instantly from memory with LCP effectively at 0ms.
Ensure your pages are bfcache-compatible
// Things that break bfcache:

❌ unload event listeners
window.addEventListener('unload', () => {
  // This prevents bfcache
});

✓ pagehide event instead
window.addEventListener('pagehide', () => {
  // This works with bfcache
});

❌ Cache-Control: no-store on page
Cache-Control: no-store

✓ Allow caching (use versioned assets instead)
Cache-Control: public, max-age=300

❌ Open connections (WebSocket, IndexedDB transactions)
const ws = new WebSocket('ws://example.com');
// Must close before page hide

✓ Clean up on pagehide
window.addEventListener('pagehide', () => {
  ws.close();
  transaction.abort();
});
Test bfcache compatibility
// Chrome DevTools:
// 1. Open DevTools > Application > Back/forward cache
// 2. Navigate to your page
// 3. Click Test back/forward cache button

// Or check programmatically:
window.addEventListener('pageshow', (event) => {
  if (event.persisted) {
    console.log('Page restored from bfcache');
    // Re-initialize any needed state
  } else {
    console.log('Page loaded normally');
  }
});

// Monitor bfcache usage in analytics
window.addEventListener('pageshow', (event) => {
  if (event.persisted) {
    analytics.track('bfcache_restore', {
      page: location.pathname
    });
  }
});
Impact: Back button navigation shows instant LCP (0-50ms) for 60-80% of users
bfcache best practice: Test your critical user journeys with the back button. Many e-commerce sites break bfcache with aggressive analytics tracking or WebSocket connections, losing out on instant back-button navigation for product browsing flows.
Monitoring LCP over time
Once you've optimised LCP, you need to ensure it stays fast:
Set up Real User Monitoring
Track LCP for every visitor to catch regressions early. Our observability implementation includes LCP tracking with full context (device, network, location).
Monitor Core Web Vitals in CI/CD
// Run Lighthouse in your CI pipeline
// Fail builds if LCP regresses

const lighthouse = require('lighthouse');
const chromeLauncher = require('chrome-launcher');

async function runLighthouse(url) {
  const chrome = await chromeLauncher.launch();
  const result = await lighthouse(url, {
    port: chrome.port,
    onlyCategories: ['performance']
  });

  const lcp = result.lhr.audits['largest-contentful-paint'].numericValue;

  if (lcp > 2500) {
    throw new Error(`LCP too slow: ${lcp}ms`);
  }

  await chrome.kill();
}
Set Performance Budgets
Define acceptable thresholds and alert when they're exceeded:
- LCP: Under 2.5s (95th percentile)
- Hero image size: Under 200KB
- TTFB: Under 800ms
- Total page size: Under 1.5MB
LCP optimisation checklist
Still struggling with LCP?
We can audit your site, identify bottlenecks, and implement proven optimisations. Get in touch or run a free benchmark to see how you compare.
Need help fixing your LCP?
We can audit your site, identify the root cause, and implement optimisations that actually work.