Interaction to Next Paint (INP): Stop frustrating users with slow buttons
User taps "Add to Cart." Nothing happens. They tap again. Still nothing. Finally, 800ms later, both taps register and two items appear in the cart. Frustrated, they remove the duplicate and consider shopping elsewhere. Your INP is costing you sales.
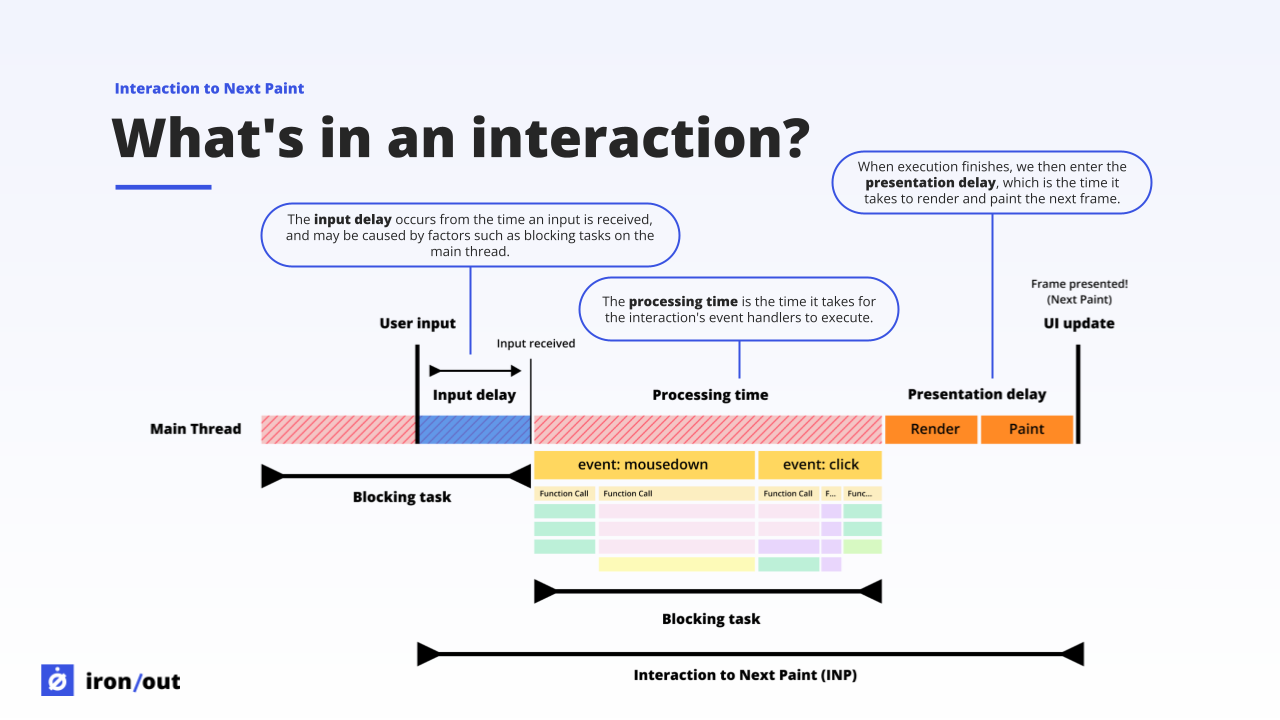
What is INP (and why it makes sites feel broken)?
INP measures the delay between when someone clicks, taps, or types and when they see visual feedback. If your button takes 600ms to respond, users think it's broken.
The brutal part: INP tracks your worst interaction, not your average. One slow button during checkout ruins the metric. One sluggish form field tanks your score. Google measures the 75th percentile. That means 25% of your users can have terrible experiences and you'll still pass. But those 25% are leaving.
Unlike the old First Input Delay (FID) metric that only checked the first interaction, INP monitors every click, tap, and keypress throughout the entire visit. It's a much harsher (and more accurate) measure of responsiveness.
INP thresholds
What counts as an interaction? Clicks, taps, and keyboard presses. Hover and scroll events are not included in INP measurements.
The hidden cost of slow interactions
Poor INP doesn't just annoy users. It breaks their mental model of how websites work. When a button doesn't respond instantly, they assume the site is broken, their internet is down, or they didn't click properly. They retry, double-click, and refresh. This creates more problems.
Double submissions
User clicks "Submit Order," nothing happens for 600ms, they click again. Now you have duplicate orders, angry customers, and refund requests.
Form abandonment
Typing in a search box with 400ms lag feels broken. Users assume the field isn't working and leave. Your checkout completion rate drops 15%.
Mobile users hit hardest
Mid-range Android devices (60% of your mobile traffic) show 3-5x worse INP than your MacBook Pro. You're optimising for the wrong device.
Real numbers: We tracked an e-commerce site that improved INP from 520ms to 180ms. Form completion increased by 11%. Duplicate submissions dropped by 73%. Support tickets about "broken buttons" disappeared completely.
How to measure INP
Field data (Real users)
INP can only be measured with real user data. Lab tools can't capture it because they don't simulate real interactions:
- Iron/Out free benchmark - Get your INP from Chrome UX Report
- Google Search Console - Core Web Vitals report shows INP by page group
- Real User Monitoring - Track INP for every visitor with our observability implementation
Debugging INP in the lab
While you can't measure INP in lab tools, you can identify the causes:
// Chrome DevTools Performance tab
// 1. Start recording
// 2. Perform the slow interaction
// 3. Stop recording
// 4. Look for:
//    - Long tasks (red flags in the timeline)
//    - JavaScript execution blocking the main thread
//    - Event handler duration

// The Performance tab shows an "Interactions" track
// that highlights slow interactions automatically
Measure INP programmatically
Install the web-vitals library:
npm install web-vitalsThen track INP:
import {onINP} from 'web-vitals';

onINP((metric) => {
  // Send to analytics
  console.log('INP:', metric.value);

  // Get the specific interaction that caused this INP
  const interaction = metric.entries[0];
  console.log('Slow interaction:', {
    type: interaction.name, // 'pointerdown', 'click', 'keydown'
    target: interaction.target, // DOM element
    duration: interaction.duration,
    startTime: interaction.startTime
  });
});
Common causes of poor INP
1. Heavy JavaScript execution
When users interact, JavaScript event handlers run on the main thread. If your handler executes 400ms of JavaScript, INP will be at least 400ms.
Fix: Break up long tasks, defer non-critical work, use web workers for heavy computation.
2. Long tasks blocking the main thread
If a long task (>50ms) is running when the user interacts, the browser can't respond until that task finishes. Users wait while JavaScript runs.
Fix: Yield to the main thread frequently, code-split large bundles, lazy load non-critical features.
3. Expensive DOM updates
After your event handler runs, the browser needs to recalculate styles, layout, and paint. Complex DOM changes take time.
Fix: Minimise DOM mutations, batch updates, avoid forced synchronous layouts, use CSS transforms instead of layout properties.
4. Third-party scripts
Analytics, ads, chat widgets, and A/B testing tools all run JavaScript on the main thread. They compete for processing time during interactions.
Fix: Audit and remove unused scripts, defer non-critical tags, use facades for heavy widgets.
5. Inefficient event handlers
Event handlers that do too much work, make synchronous network requests, or trigger cascading updates can block for hundreds of milliseconds.
Fix: Optimise handler logic, debounce/throttle high-frequency events, make handlers async where possible.
INP optimisation techniques
1. Break up long tasks
The browser can only respond to interactions between tasks. Break long-running JavaScript into smaller chunks to give the browser opportunities to handle user input.
Yield to the main thread
// Bad: Processes all items in one long task
function processItems(items) {
  items.forEach(item => {
    // Heavy processing
    heavyWork(item);
  });
}

// Good: Yields after each batch
async function processItems(items) {
  for (let i = 0; i < items.length; i++) {
    heavyWork(items[i]);

    // Yield to browser every 5 items
    if (i % 5 === 0) {
      await new Promise(resolve => setTimeout(resolve, 0));
    }
  }
}

// Better: Use scheduler.yield() (Chrome 115+, Firefox 2025+)
async function processItems(items) {
  for (let i = 0; i < items.length; i++) {
    heavyWork(items[i]);

    // Yield every 5 items to let browser handle interactions
    if (i % 5 === 0) {
      await scheduler.yield();
    }
  }
}
Impact: Can reduce INP by 100-300ms on pages with heavy JavaScript
2. Optimise event handlers
Defer non-critical work
// Bad: Everything runs immediately
button.addEventListener('click', () => {
  updateUI();           // Critical
  trackAnalytics();     // Not critical
  updateRecommendations(); // Not critical
  syncToServer();       // Not critical
});

// Good: Only critical work is synchronous
button.addEventListener('click', () => {
  // Immediate visual feedback
  updateUI();

  // Defer everything else
  setTimeout(() => {
    trackAnalytics();
    updateRecommendations();
    syncToServer();
  }, 0);
});

// Better: Use requestIdleCallback for non-urgent work
button.addEventListener('click', () => {
  updateUI();

  requestIdleCallback(() => {
    trackAnalytics();
    updateRecommendations();
  });

  // Still defer server sync but with higher priority
  setTimeout(() => syncToServer(), 0);
});
Debounce expensive handlers
// For search input, filtering, etc.
function debounce(fn, delay) {
  let timeoutId;
  return function(...args) {
    clearTimeout(timeoutId);
    timeoutId = setTimeout(() => fn.apply(this, args), delay);
  };
}

const searchInput = document.querySelector('#search');
const debouncedSearch = debounce((query) => {
  // Expensive search operation
  performSearch(query);
}, 300);

searchInput.addEventListener('input', (e) => {
  debouncedSearch(e.target.value);
});
3. Minimise DOM manipulation
Batch DOM updates
// Bad: Multiple layout recalculations
items.forEach(item => {
  const element = document.createElement('div');
  element.textContent = item.title;
  container.appendChild(element); // Layout recalc each time
});

// Good: Build fragment first
const fragment = document.createDocumentFragment();
items.forEach(item => {
  const element = document.createElement('div');
  element.textContent = item.title;
  fragment.appendChild(element);
});
container.appendChild(fragment); // Single layout recalc

// Better: Use innerHTML for large updates (faster)
const html = items.map(item =>
  `<div>${item.title}</div>`
).join('');
container.innerHTML = html;
Avoid forced synchronous layouts
// Bad: Reading layout properties forces immediate recalc
element.style.width = '100px';
const height = element.offsetHeight; // Forces layout
element.style.height = height + 'px'; // Another layout

// Good: Read all layout properties first, then write
const width = element.offsetWidth;
const height = element.offsetHeight;
element.style.width = width + 10 + 'px';
element.style.height = height + 10 + 'px';

// Better: Use CSS when possible
element.classList.add('expanded'); // No JavaScript layout thrashing
4. Use web workers for heavy computation
// Main thread - stays responsive
const worker = new Worker('/data-processor.js');

button.addEventListener('click', () => {
  // Immediate feedback
  button.disabled = true;
  button.textContent = 'Processing...';

  // Heavy work happens off main thread
  worker.postMessage({ data: largeDataset });
});

worker.onmessage = (e) => {
  // Update UI with results
  displayResults(e.data);
  button.disabled = false;
  button.textContent = 'Process';
};

// data-processor.js (runs in worker)
self.onmessage = (e) => {
  const results = heavyComputation(e.data);
  self.postMessage(results);
};
5. Code splitting and lazy loading
// React/Next.js: Load heavy components only when needed
import dynamic from 'next/dynamic';

const HeavyChart = dynamic(() => import('./HeavyChart'), {
  loading: () => <p>Loading chart...</p>
});

// Vanilla JS: Dynamic imports
button.addEventListener('click', async () => {
  const { initChart } = await import('./chart-library.js');
  initChart(data);
});

// Webpack/Vite: Lazy load routes
const routes = [
  {
    path: '/dashboard',
    component: () => import('./Dashboard.jsx')
  }
];
Advanced INP optimisation strategies
Yield to the browser with scheduler.yield()
When processing large datasets, yield control back to the browser periodically so it can handle user interactions. Unlike setTimeout(0), scheduler.yield() prioritises the continuation of your code — other queued tasks will not jump ahead. Available in Chrome 115+ and Firefox (since August 2025). Safari does not support it yet.
// Break up long tasks to allow interaction handling
async function processLargeDataset(data) {
  for (let i = 0; i < data.length; i++) {
    processItem(data[i]);

    // Yield every 5 items to let browser handle interactions
    if (i % 5 === 0) {
      await scheduler.yield();
    }
  }

  onComplete();
}

// Fallback for browsers without scheduler.yield()
async function yieldToMain() {
  if ('scheduler' in window && 'yield' in scheduler) {
    return scheduler.yield();
  }
  return new Promise(resolve => setTimeout(resolve, 0));
}

async function processLargeDataset(data) {
  for (let i = 0; i < data.length; i++) {
    processItem(data[i]);

    if (i % 5 === 0) {
      await yieldToMain();
    }
  }

  onComplete();
}
Why this works: Long tasks (over 50ms) block the main thread. By yielding periodically, you break one long task into multiple shorter tasks, giving the browser chances to process clicks, taps, and keystrokes between chunks of work.
Use content-visibility for off-screen content
/* Prevent browser from rendering off-screen content */
.article-section {
  content-visibility: auto;
  contain-intrinsic-size: 1000px; /* Estimated height */
}

/* Reduces layout work during interactions by 50-80%
   on pages with lots of off-screen content */
Optimise React rendering
// Use React.memo to prevent unnecessary re-renders
const ExpensiveComponent = React.memo(({ data }) => {
  return <div>{/* Complex render */}</div>;
});

// Use useCallback for event handlers
const MyComponent = () => {
  const handleClick = useCallback(() => {
    // Handler logic
  }, []); // Dependencies

  return <button onClick={handleClick}>Click</button>;
};

// Use useDeferredValue for non-urgent updates
const MyComponent = ({ searchTerm }) => {
  const deferredSearchTerm = useDeferredValue(searchTerm);
  const results = useMemo(() =>
    expensiveSearch(deferredSearchTerm),
    [deferredSearchTerm]
  );

  return <Results data={results} />;
};

// Use startTransition for non-urgent state updates
import { startTransition } from 'react';

const handleSearch = (value) => {
  setInputValue(value); // Urgent: update input
  startTransition(() => {
    setSearchResults(search(value)); // Not urgent
  });
};
React 19.2+ Activity component
The new <Activity /> component handles modal/tab visibility without unmounting, preserving state and preventing re-renders. See React docs for details.
Monitoring INP over time
INP is the hardest Core Web Vital to monitor because it varies by user behaviour. Different users trigger different interactions.
Track problematic interactions
import {onINP} from 'web-vitals';

onINP((metric) => {
  // Only report poor INP (> 200ms)
  if (metric.value > 200) {
    const interaction = metric.entries[0];

    // Send detailed context to analytics
    analytics.track('poor_inp', {
      inp_value: metric.value,
      interaction_type: interaction.name,
      target_element: interaction.target?.tagName,
      target_id: interaction.target?.id,
      target_class: interaction.target?.className,
      page_url: location.pathname,
      user_agent: navigator.userAgent
    });
  }
});
Set up alerts
- CrUX API: Monitor your 75th percentile INP weekly
- RUM threshold alerts: Get notified when INP exceeds 200ms for >10% of users
- Regression detection: Alert when INP increases by >50ms after deployment
Performance budgets
- INP: Under 200ms (75th percentile)
- JavaScript bundle size: Under 300KB (gzipped)
- Long tasks: No tasks over 200ms
- Third-party scripts: Under 5 total
INP optimisation checklist
Still seeing poor INP?
INP is the hardest Core Web Vital to optimise. We can profile your interactions, identify bottlenecks, and implement proven fixes. Get in touch or run a free benchmark to see your current INP.
Need help fixing your INP?
We can identify JavaScript bottlenecks and implement optimisations that make your site feel instantly responsive.